Flat
The zero line
Baseline
The signal when nothing is leaving the column. A flat, quiet baseline is the reference every peak is measured against.
(“kroh-MAT-uh-gram”)
The picture behind every HPLC purity number, and how to read it.
The short answer
A chromatogram is the trace a chromatography run records: detector response on the vertical axis, time on the horizontal, with each separated component appearing as a peak.
As a sample passes through the column, its components leave at different times and the detector draws a peak for each one. Where a peak appears, its retention time, helps identify it; how big it is, its area, shows how much of it is present. HPLC purity is simply the main peak’s area as a share of the total area of all integrated peaks.
Reviewed by the Codex Research quality teamUpdated Nov 8, 2026
Word study
Say it
chro·mat·o·gram
(“kroh-MAT-uh-gram”)
Roots and origin
RootGreek
OriginGreek
A chromatogram is literally a record written in color. Mikhail Tsvet coined the family of terms in the early 1900s when he separated plant pigments into colored bands on a column; modern chromatograms record invisible components as peaks instead.
Around the world
Tap a language to hear it spokenDefinition
A chromatogram is the record of a chromatographic separation. IUPAC defines a peak as the portion of the detector trace recorded when a single component leaves the column. Plot detector signal against time for a whole run and you get the chromatogram: a mostly flat baseline interrupted by one peak for each component that was separated.
Position tells you what; size tells you how much. The time from injection to the top of a peak is its retention time, which depends on the compound and the method and is used to recognize it. The area under the peak is proportional to the amount of that component reaching the detector, which is why areas, not heights, are used for calculations.
For peptides, the usual trace comes from reversed-phase HPLC with UV detection around 214 to 220 nm, where the peptide bond absorbs. The target peptide forms one large main peak. Closely related impurities, such as a chain missing one residue or an oxidized form, usually appear as small peaks just before or after it.
HPLC purity is read straight from the integrated chromatogram: the main peak’s area as a percentage of the total area of all integrated peaks, excluding system and solvent peaks. The result is only as good as the separation. If an impurity sits underneath the main peak instead of beside it, it is counted as product and the purity reads too high.
Method quality shows in the trace itself. Peaks should be sharp and reasonably symmetrical, the baseline should be steady, and the main peak should be resolved from its nearest neighbor. Regulatory guidance on chromatographic methods sets numerical checks for exactly these features, such as resolution and tailing factor, before results are relied on.
Anatomy
The signal when nothing is leaving the column. A flat, quiet baseline is the reference every peak is measured against.
The time an unretained substance takes to pass through the column, often marked by a small solvent disturbance. Peaks here have not really been separated.
The time from injection to the top of a peak. Under the same method, the same compound comes out at the same time.
The integrated area under a peak, proportional to how much of that component reached the detector. Purity is calculated from areas.
How well two neighboring peaks are separated. A resolution of about 1.5 or more is generally treated as baseline separation.
Interactive
A simulated HPLC trace of a 97.8% pure peptide. At normal scale the impurities almost disappear beside the main peak; zoom in to find them, and tap any peak to see its retention time and share of the total area.
A simulated reversed-phase trace. Tap a row or a peak to highlight it. HPLC purity is the main peak’s share of the total integrated area: here 97.8%. Every peak above the method’s reporting threshold counts, however small it looks at normal scale.
For buyers
Every HPLC purity figure is a calculation on a chromatogram. Seeing the trace is seeing the evidence behind the number.
Sharp, separated peaks on a steady baseline show a method that can actually see the impurities it reports on.
A real chromatogram carries lot-specific detail. Reused or cropped traces are one of the clearest signs of a weak certificate.
At Codex Research
Each Codex Research product page carries a lot-matched certificate of analysis reporting HPLC purity and mass spectrometry identity for the lot in stock.
See it live: the HPLC purity guide in the glossary
Myth vs fact
Tap a card to flip it.
Watch for
Quick check
Time on the bottom, detector response on the side, and a stated wavelength.
Sharp and symmetrical, with no shoulder or long tail.
The peak table’s main area % should equal the purity on the certificate.
 Full walkthrough · JournalHPLC vs mass spec: how purity is tested
Questions
The graph a chromatography run produces: detector signal against time, with one peak for each separated component.
Each peak is one component. Its position, the retention time, helps identify it, and its area shows how much is present. Purity is the main peak’s share of the total area.
The time between injection and the top of a peak. Under the same method, the same compound elutes at the same time.
Area is proportional to the amount of a component, while height also depends on how broad or narrow the peak is.
Often a second component eluting very close to the first. It can hide an impurity inside what looks like the main peak.
Usually around 214 to 220 nm, where the peptide bond absorbs UV light.
A resolution of about 1.5 or more between two peaks is generally considered baseline separation.
Sources and standards
Written and reviewed by the Codex Research quality team · Last reviewed November 8, 2026 · For laboratory research use only.
On real products
These products’ current certificates report purity by RP-HPLC, the method behind chromatogram. See the result on each product page, then read the full guide.
 Cellular
Research peptide
Cellular Research
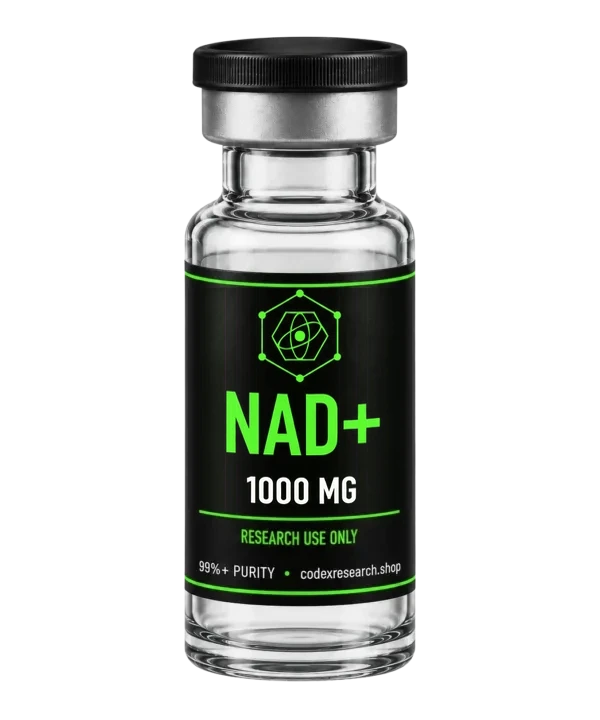
NAD+ is nicotinamide adenine dinucleotide, the oxidized redox coenzyme and sirtuin substrate, supplied as lyophilized powder in 500 mg and 1000 mg vials. Lot-tested by LC-MS.
 Neuro
Research peptide
Neuropeptide Research
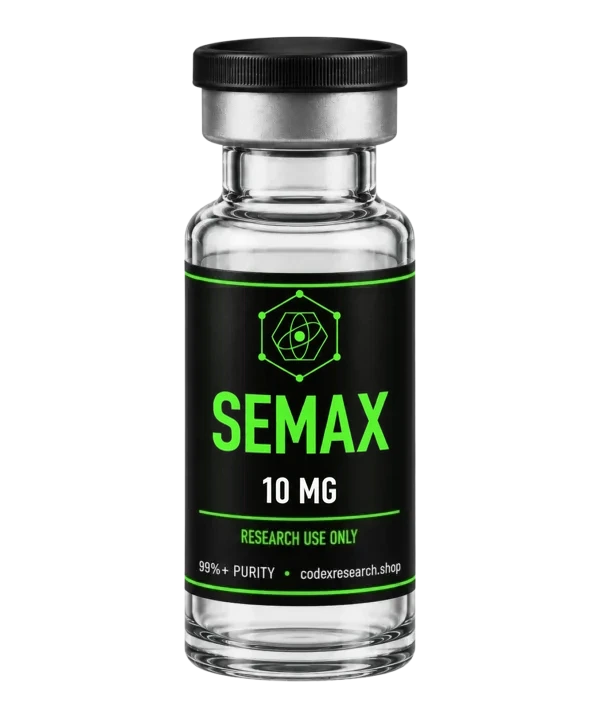
Semax is a seven-residue ACTH(4-7) analogue with a Pro-Gly-Pro tail, studied in BDNF, trkB and cholinergic-neuron research. 5 mg and 10 mg vials, lot-tested by LC-MS.
 Blends
Research peptide
GH-Axis Research
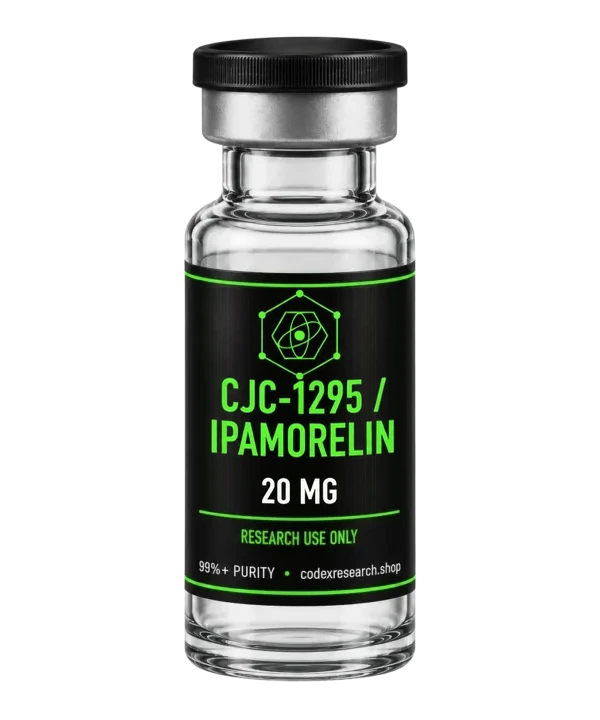
A single vial pairing CJC-1295 without DAC, a tetrasubstituted GRF(1-29) analog, with Ipamorelin, a five-residue ghrelin-receptor agonist. Lot-tested by RP-HPLC.
Journal guideHPLC vs mass spec: how purity is testedRead the guideKeep going
 From lab to your door
U.S.-made research vials, shipped with lot-matched, lab-tested COAs you can scan straight off the label.

21+ Only
Codex Research provides research-grade compounds for laboratory and research use only. By entering, you confirm you are at least 21 and agree to our Terms & Conditions.
By proceeding you affirm the statements above are true. Products are supplied for laboratory research use only — not for human or veterinary use, not for use in diagnostic procedures, and not evaluated by the U.S. Food and Drug Administration. Full disclaimer.