

HPLC and mass spectrometry answer two different questions about a research peptide: how much of the material is the target, and whether the target is the right molecule. This guide explains how each method works, what each one cannot see, and why a credible COA reports both.
Key takeaways
- HPLC answers "what percentage of the sample is the target?" by separating the sample and measuring the main peak as a share of all peaks. Mass spectrometry answers "is it the right molecule?" by measuring molecular mass.
- Neither method is enough on its own. A wrong peptide can still give one clean HPLC peak, and a correct mass says nothing about how much impurity is present.
- HPLC purity is an area ratio, not an amount. It does not see water, salts or counter-ions, which is why purity and peptide content are reported separately.
- Mass spectrometry cannot tell apart molecules with identical mass, such as leucine and isoleucine or D- and L-amino acids, so chromatography and tandem MS fill those gaps.
- The strongest reports name the method for each result, show the chromatogram and mass spectrum, and come from an independent lab testing the same lot you received.
ImportantResearch use only. This guide explains how laboratory analytical methods are used to test research materials. It does not describe human or animal use. Codex Research compounds are not approved by the FDA and are sold for in-vitro laboratory research only.
Quick answer
HPLC and mass spectrometry answer two different questions. Reversed-phase high-performance liquid chromatography (RP-HPLC) separates a sample into its components and reports how much of what it detects is the main peptide, which is the purity figure on a COA. Mass spectrometry (MS, usually coupled to chromatography as LC-MS) measures molecular mass, which confirms identity: that the main peptide is the molecule it is supposed to be.
Neither method is complete on its own. A wrong peptide can produce one clean HPLC peak, and a correct mass says nothing about how many impurities sit alongside it. That is why a credible peptide certificate of analysis reports both.
The two questions every peptide test has to answer
Every lot of a synthetic peptide has to clear two hurdles before its results mean anything in a laboratory:
- Is it the right molecule? A synthesis can produce the wrong sequence, a sequence with a substituted residue, or a different compound altogether.
- How much of the material is that molecule? Even a correct synthesis leaves related impurities, such as chains missing an amino acid, oxidized residues or incompletely removed protecting groups [12].
| Question | Method that answers it | What appears on a COA |
|---|---|---|
| Is it the right molecule? | Mass spectrometry (LC-MS, ESI-MS or MALDI-TOF) | Identity: measured mass vs theoretical mass, "Conforms" |
| How much of it is the target? | Reversed-phase HPLC with UV detection | Purity: main-peak area %, e.g. 99.23% |
| How many milligrams are present? | Quantitative HPLC against a standard, amino acid analysis or nitrogen content | Potency / assay / net peptide content |
| Is anything else in there? | Endotoxin, sterility, microbial and residual tests | Contaminant results against limits |
This guide covers the first two rows, because they are the ones most often confused.
How HPLC works, step by step
High-performance liquid chromatography pushes a liquid sample through a narrow column packed with tiny porous particles. Different molecules travel through that column at different speeds, so they leave it at different times and can be measured one by one.
For peptides, the standard mode is reversed-phase chromatography [1]:
- The column is packed with silica particles bonded to long hydrocarbon chains, most often C18. That surface is hydrophobic.
- The mobile phase starts mostly water and gradually shifts toward an organic solvent, usually acetonitrile, over the run. This is called a gradient.
- An acid modifier, typically 0.1% trifluoroacetic acid (TFA), is added to both solvents. It pairs with the charged groups on the peptide and sharpens the peaks.
- Separation happens because each peptide sticks to the column according to its overall hydrophobicity. More hydrophobic peptides need more organic solvent to be released, so they elute later.
The contribution of individual amino acids to that retention has been measured systematically: researchers have derived hydrophobicity coefficients for each side chain from the retention of model peptides, which is why even a single-residue change can move a peak [2].
What the detector sees
As components leave the column they pass through a UV detector, usually set between 210 and 220 nm. At that wavelength the peptide bond itself absorbs light, so essentially every peptide-related component, target and impurity alike, produces a signal. The detector records a chromatogram: a trace of signal over time, with one peak for each separated component.
How the purity number is calculated
Purity is calculated by area normalization:
Purity (%) = area of the main peak ÷ total area of all integrated peptide peaks × 100
So a lot reported at 99.23% purity means the main peak accounts for 99.23% of the total peak area the detector recorded, and the remaining 0.77% is spread across related impurities.
Inside a typical peptide purity method
Every HPLC purity result comes from a specific set of conditions. Labs choose and validate their own, but most peptide purity methods look broadly like this [1]:
| Parameter | Typical choice | Why it matters |
|---|---|---|
| Column | C18 reversed-phase, 100–300 Å pores, 1.7–5 µm particles | Wider pores suit larger peptides; smaller particles give sharper peaks |
| Mobile phase A | Water with 0.1% TFA | Aqueous starting solvent; TFA pairs with basic residues |
| Mobile phase B | Acetonitrile with 0.1% TFA | Organic solvent that releases peptides from the column |
| Gradient | Slow rise in B over 20–60 minutes | Shallower gradients separate closely related impurities better |
| Column temperature | Often 25–60 °C | Affects retention and peak shape |
| Detection | UV at 210–220 nm | The peptide bond absorbs here, so impurities are seen too |
| Injection | A measured volume of dissolved sample | Must stay within the method's validated range |
None of these settings is exotic. What separates a careful lab from a careless one is whether the conditions are validated for the peptide being tested, applied consistently, and reported.
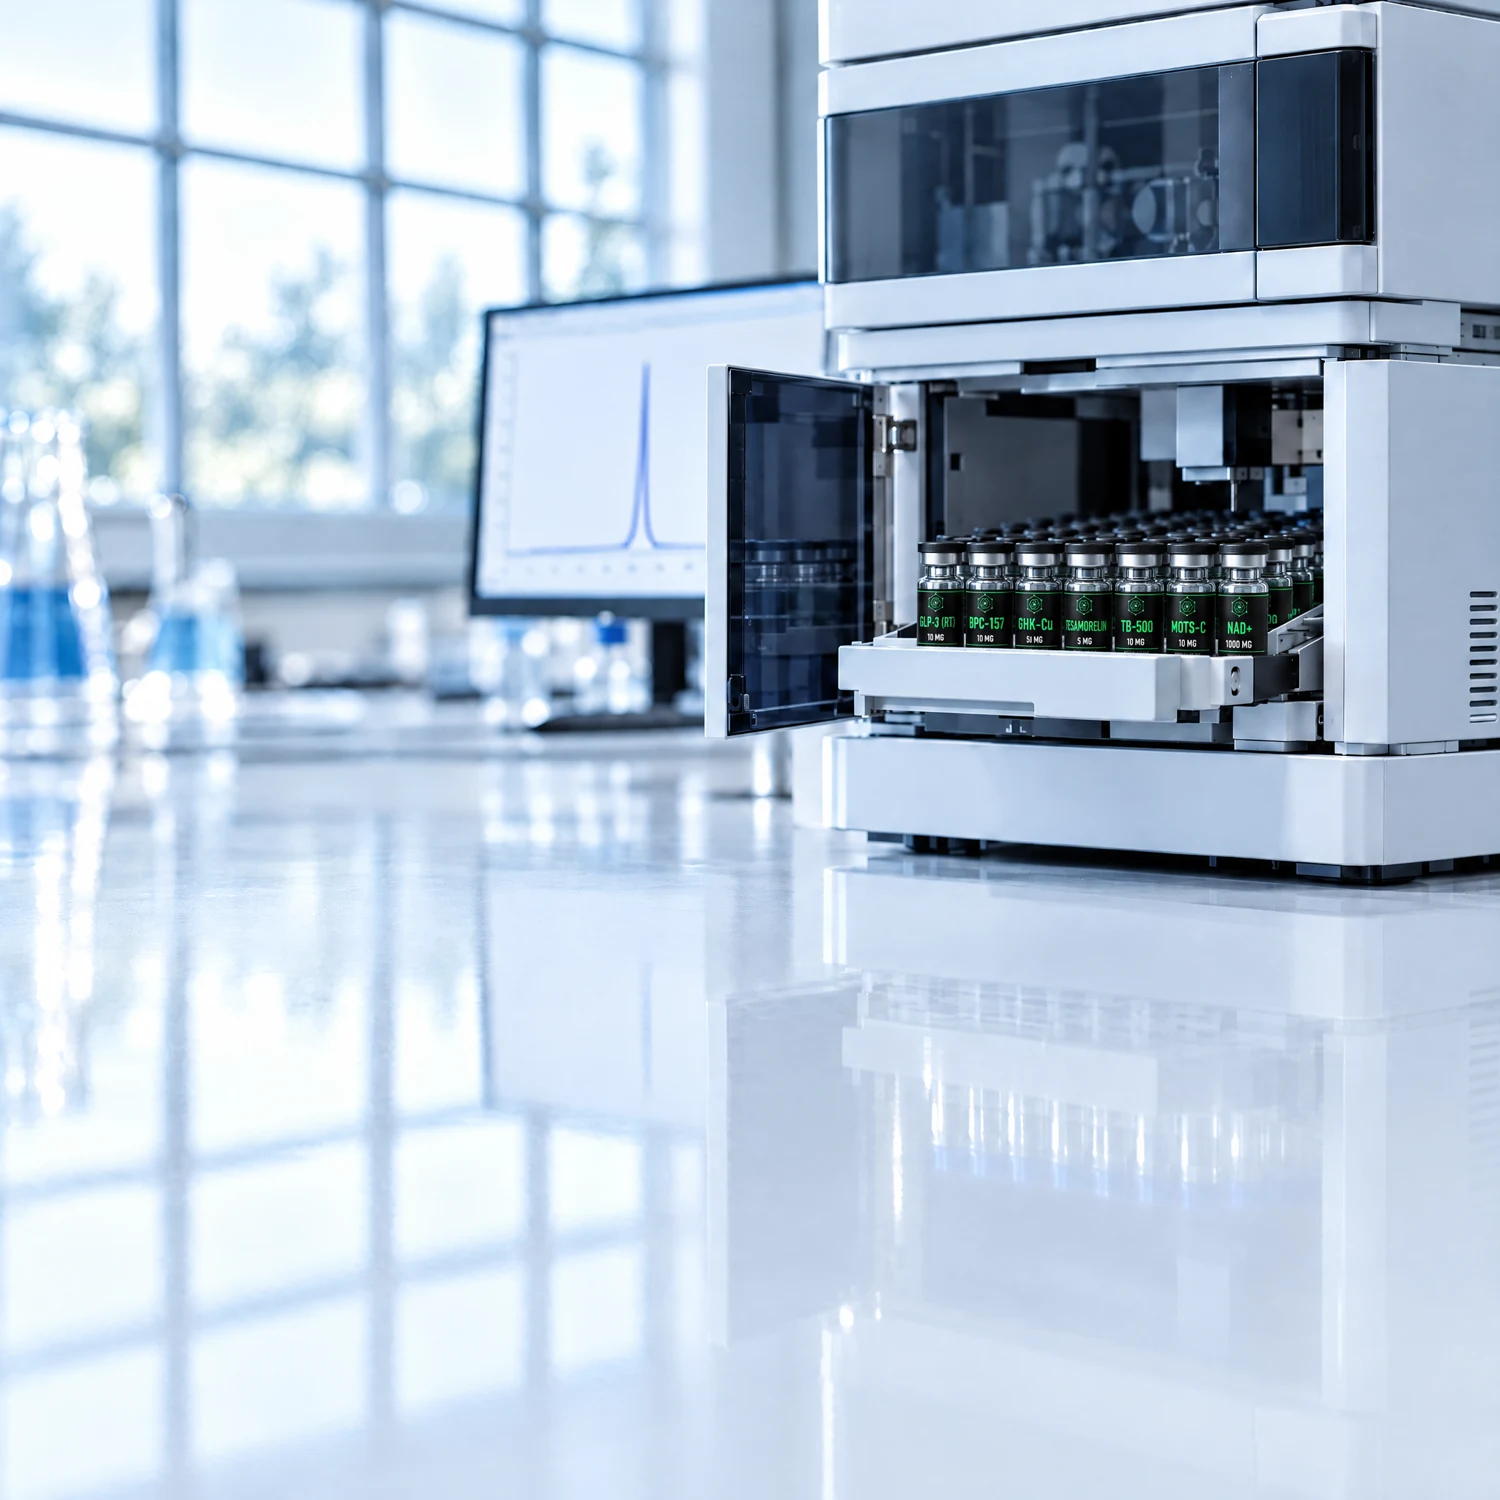
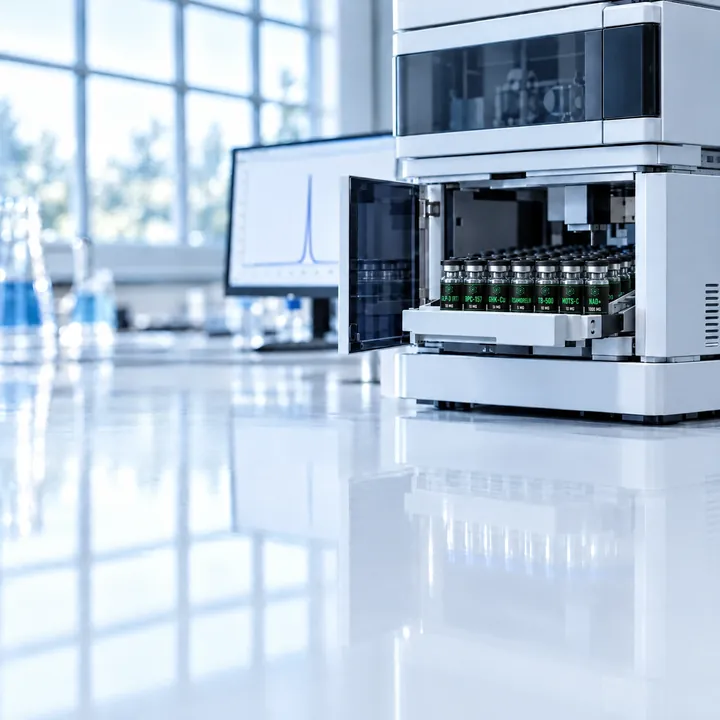
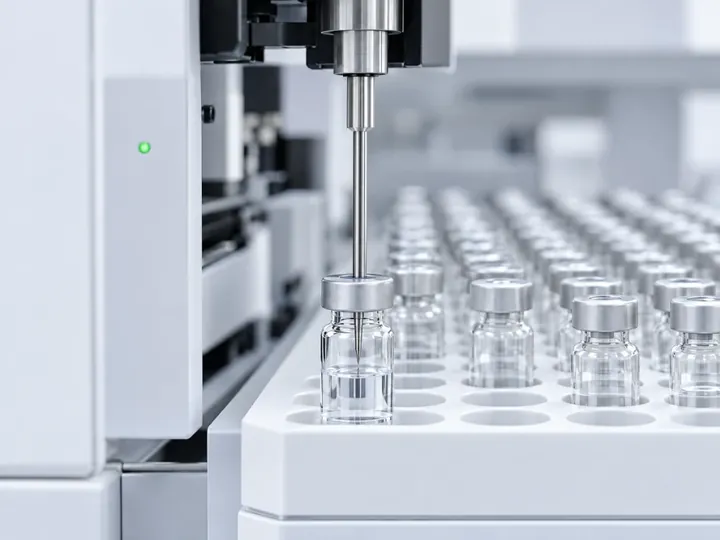
An HPLC system. The autosampler injects each sample onto the column, and the detector records the chromatogram used to calculate purity.
What a chromatogram tells you
| Feature | What it means |
|---|---|
| Retention time | When the main peak left the column. It should be consistent for the same peptide under the same method. |
| Main-peak area | The basis of the purity percentage. |
| Small peaks before the main peak | Usually more hydrophilic impurities, such as some truncated or deletion sequences. |
| Small peaks after the main peak | Usually more hydrophobic impurities, such as sequences with leftover protecting groups. |
| Shoulders or a broad main peak | A possible co-eluting impurity hidden under the main peak. |
| Flat, quiet baseline | Good separation with little background noise. |
How mass spectrometry works
A mass spectrometer measures the mass-to-charge ratio (m/z) of ions. To do that it has to turn the peptide into a gas-phase ion, separate ions by m/z, and count them.
Getting peptides into the instrument
Two soft ionization techniques made mass spectrometry of peptides and proteins routine. The 2002 Nobel Prize in Chemistry honored this field, including electrospray:
- Electrospray ionization (ESI). The liquid sample is sprayed through a charged needle into a fine mist. As droplets evaporate, peptides are left carrying one or more extra protons. ESI works directly on the liquid flowing out of an HPLC column, which is why it is the basis of LC-MS [3].
- Matrix-assisted laser desorption/ionization (MALDI). The peptide is mixed with a light-absorbing matrix, dried on a plate and hit with a laser pulse. MALDI mostly produces singly charged ions and is often paired with a time-of-flight (TOF) analyzer [4].
Reading the spectrum
Because ESI can add several protons, one peptide appears at several m/z values. For a 1,418.70 Da peptide, the singly protonated ion [M+H]⁺ appears near m/z 1419.71 and the doubly protonated ion [M+2H]²⁺ near m/z 710.36. Software deconvolutes those charge states back into a single neutral mass.
Every ion also shows a small isotope cluster, because a fraction of the carbon atoms in any molecule are carbon-13 rather than carbon-12. That leads to two different "masses" for the same molecule:
| Mass type | Definition | BPC-157 (GEPPPGKPADDAGLV) |
|---|---|---|
| Monoisotopic mass | Uses the most abundant isotope of each element | ≈ 1418.70 Da |
| Average mass (molecular weight) | Weighted by natural isotope abundance | ≈ 1419.55 g/mol |
| [M+H]⁺ | Singly protonated ion, common in MALDI | m/z ≈ 1419.71 |
| [M+2H]²⁺ | Doubly protonated ion, common in ESI | m/z ≈ 710.36 |
When a COA states an identity result, it should compare the measured mass with the theoretical mass for the expected sequence. High-resolution analyzers such as Orbitrap and modern TOF instruments measure mass to within a few parts per million, which makes accidental matches very unlikely.
Confirming the sequence with tandem MS
A matching total mass confirms composition, but not order. Two peptides containing the same amino acids in a different order have the same mass. Tandem mass spectrometry (MS/MS) solves this by selecting the peptide ion, breaking it into fragments, and measuring those fragments. Peptides tend to break along the backbone, producing ladders of fragment ions whose spacing spells out the sequence [5].
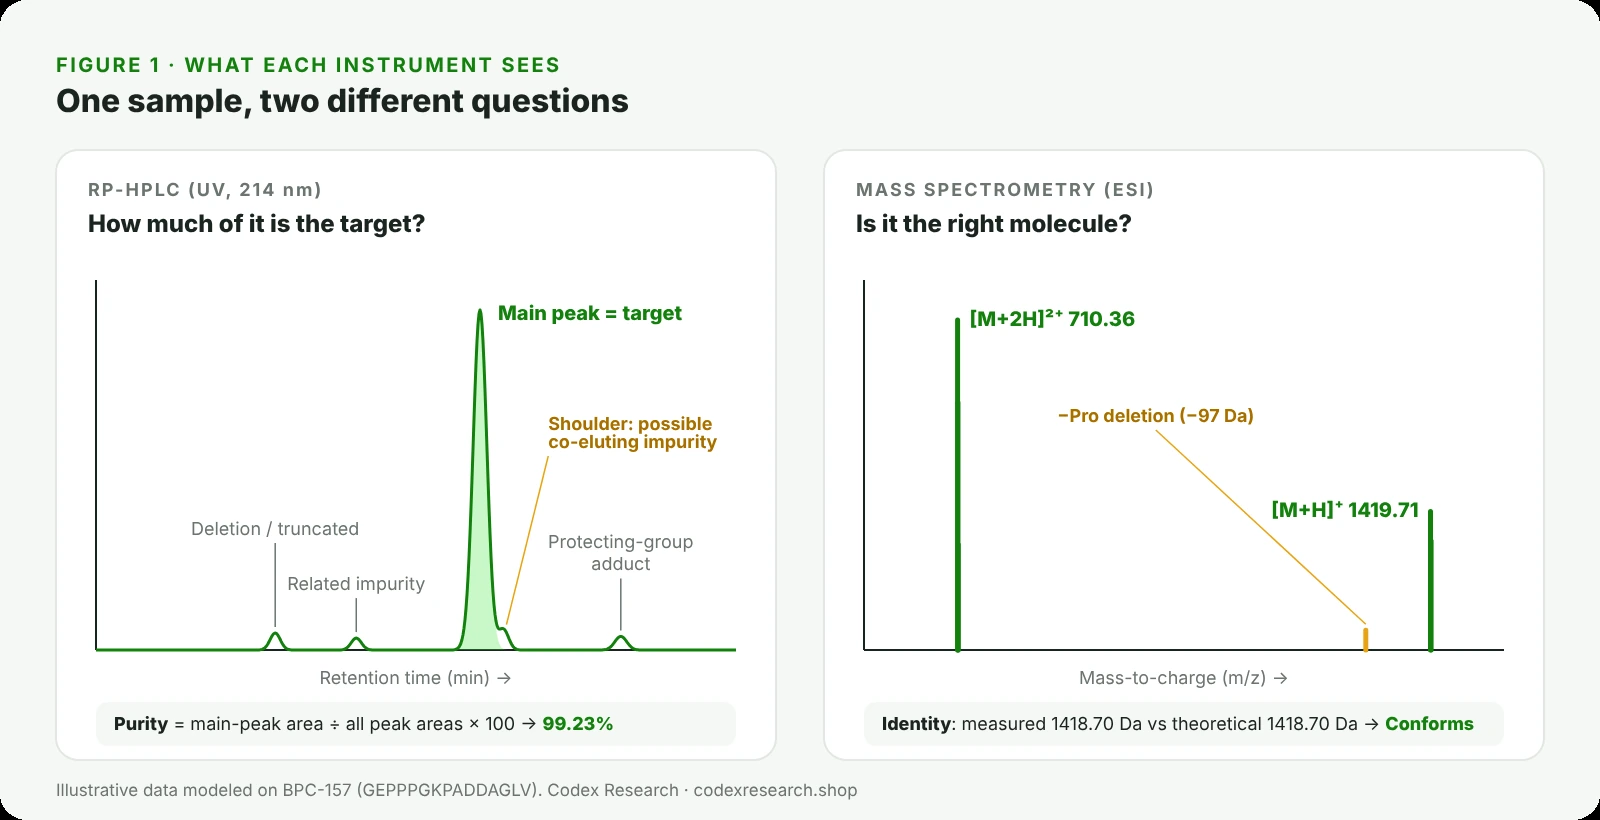
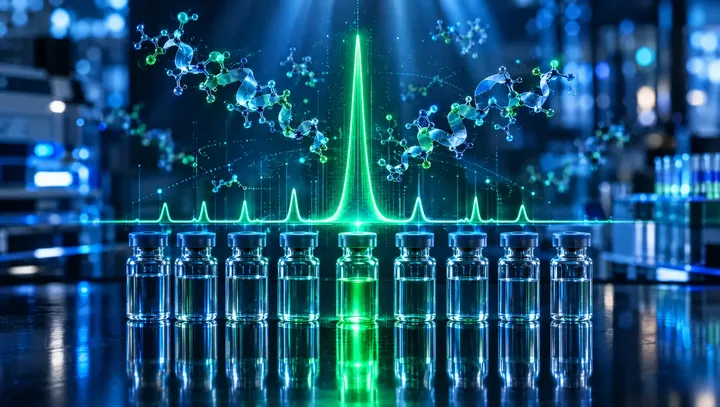
Figure 1. The same sample seen two ways. HPLC measures how much of the material is the main peak; mass spectrometry confirms that the main component has the right mass. Illustrative data modeled on BPC-157.
Head-to-head: HPLC vs mass spectrometry
| RP-HPLC (UV) | Mass spectrometry | |
|---|---|---|
| Main question | What percentage of the sample is the target? | Is the molecule the expected one? |
| What it measures | UV absorbance over time | Mass-to-charge ratio of ions |
| Output | Chromatogram; area % purity | Mass spectrum; measured mass |
| Quantitative? | Yes, broadly proportional to peptide amount | Not inherently; ionization efficiency varies |
| Confirms identity? | No | Yes |
| Separates same-mass isomers? | Often, if they differ in hydrophobicity | No, not by mass alone |
| Sees water, salts, counter-ions? | No | Generally not reported |
| Typical COA line | Purity ≥ 98.0%: 99.23% | Identity: Conforms (LC-MS) |
What HPLC cannot tell you
HPLC is the right tool for purity, but it has blind spots:
- It cannot confirm identity. The main peak is simply the biggest peak. If the synthesis produced the wrong peptide cleanly, the purity number can still be high. Independent re-testing has found research peptides where the main compound had a different structure from the one ordered, even though supplier reports showed acceptable purity [13].
- Co-eluting impurities can hide. An impurity with nearly the same hydrophobicity can sit under the main peak and inflate the purity value. Peak-purity checks using diode-array spectra or mass spectra across the peak were developed precisely to catch this [8].
- It does not see non-peptide mass. Water, inorganic salts and counter-ions such as trifluoroacetate or acetate do not absorb meaningfully at 214 nm. That is why a lot can be 99% pure while the actual peptide content is a few percent below the label weight.
- Area percent assumes similar responses. Area normalization works well because related impurities share the same peptide backbone, but impurities with very different structures can absorb more or less strongly than the target.
What mass spectrometry cannot tell you
Mass spectrometry is the right tool for identity, but it has its own blind spots:
- Same-mass isomers look identical. Leucine and isoleucine have exactly the same mass, as do D- and L-forms of any amino acid. Distinguishing leucine from isoleucine requires specialized fragmentation and high-resolution tandem MS, an active research area in its own right [9]. Racemized residues, a known synthesis impurity, are usually caught by chromatography instead, because the resulting diastereomers often elute at a different time [12].
- It is not a purity measurement on its own. Different molecules ionize with different efficiency, and some suppress the signal of others, so peak heights in a mass spectrum do not reliably reflect amounts.
- Mobile-phase choice matters. The same TFA that sharpens HPLC peaks suppresses the electrospray signal. Methods built for LC-MS often switch to formic acid or other modifiers, or add components that counteract the suppression [6, 7]. This is one reason purity and identity are frequently run as separate methods.
TipA COA that reports "Identity: Conforms" is stronger when it also shows the measured mass and the theoretical mass side by side. "Conforms" with no numbers behind it is harder to check.
Why the best reports use both: LC-MS and orthogonal methods
Because each method covers the other's blind spots, analytical labs combine them. In LC-MS, the HPLC separates the sample and the mass spectrometer identifies what is in each peak. That lets an analyst assign an identity not only to the main peak but to the impurities around it.
Regulated peptide work takes this further with orthogonal methods: separations based on different principles applied to the same sample. A recent study of the peptide bivalirudin, for example, developed three orthogonal chromatographic methods and then characterized the degradation products with high-resolution mass spectrometry [11]. Another used LC-HRMS to compare the structurally related impurity profiles of teriparatide made by chemical synthesis with teriparatide made by recombinant DNA technology [10].
For approved synthetic peptide drugs, FDA guidance expects peptide-related impurities at 0.10% of the drug substance or above to be identified, and limits any new specified impurity to 0.5% [14]. Research materials are not held to drug standards, but that benchmark shows how seriously individual impurities are treated when the stakes are highest, and why mass spectrometry, the tool that identifies them, sits beside HPLC in serious quality control.
Common peptide impurities and how each method catches them
Solid-phase peptide synthesis and storage produce a predictable family of related impurities [12]. Each one has a signature that one or both methods can detect:
| Impurity type | What happened | Mass shift vs target | Usually caught by |
|---|---|---|---|
| Deletion sequence | One amino acid failed to couple | Minus that residue (e.g. −97.05 Da for proline) | MS; often HPLC |
| Insertion sequence | An amino acid coupled twice | Plus that residue | MS; often HPLC |
| Truncated chain | Synthesis stopped early | Large loss | HPLC and MS |
| Incomplete deprotection | A protecting group was left on | Plus the group (e.g. +56 Da for t-butyl) | HPLC (later peak) and MS |
| Oxidation | Methionine or tryptophan oxidized | +16 Da per oxygen | MS; sometimes HPLC |
| Deamidation | Asparagine or glutamine converted | +0.98 Da | High-resolution MS; HPLC |
| Racemization | An L-residue became D | 0 Da | HPLC only (diastereomer) |
| Counter-ion (TFA, acetate) | Salt form from purification | Not part of the peptide | Neither; tested separately |
To make this concrete: if BPC-157 (monoisotopic mass ≈ 1418.70 Da) lost one proline during synthesis, the deletion impurity would appear at about 1321.65 Da, nearly 100 Da lighter and easy for a mass spectrometer to flag. A racemized residue, by contrast, would weigh exactly the same, and only chromatography would separate it.
Other ways labs measure how much peptide is present
Purity and identity do not tell you how many milligrams of peptide are actually in a vial. A lyophilized powder also holds residual water and counter-ions, so labs use separate techniques to measure peptide content:
| Technique | How it works | What it reports |
|---|---|---|
| Quantitative HPLC | Compares the sample's main-peak area with a reference standard of known concentration | mg of peptide, often shown as potency or assay |
| Amino acid analysis | Breaks the peptide into its amino acids by hydrolysis and measures each one | Net peptide content as a % of the powder |
| Nitrogen (CHN) analysis | Measures total nitrogen and calculates peptide from the sequence's nitrogen share | Net peptide content |
| Ion chromatography | Separates and measures counter-ions such as trifluoroacetate, acetate or chloride | Counter-ion content |
| Karl Fischer titration | Reacts with water in the sample | Water content |
These results explain the gap between purity and label weight. A lot can be 99% pure by HPLC while the powder is, for example, 80–90% peptide by weight, with the rest made up of water and counter-ions. Both numbers are correct; they answer different questions.
Why two labs can report different purity for the same lot
Purity is a measured value, not a fixed property printed on the molecule, so the same material can give slightly different numbers in different hands. Common reasons include:
- Different gradients or columns. A steeper gradient can merge an impurity into the main peak; a shallower one can separate it. The first lab may report higher purity simply because it resolved less.
- Different detection wavelengths. Impurities that absorb differently from the target change their share of total area as the wavelength changes.
- Integration rules. How a lab draws the baseline and where it sets the threshold for counting a small peak both affect the final percentage.
- Sample age and handling. A peptide that has oxidized or degraded between two tests will show more impurity in the second.
- Different questions. One lab may report HPLC area purity while another reports content against a standard. The numbers are not comparable.
This is why a single purity figure means most when it comes with its method, its specification and its chromatogram, and why independent re-testing, the kind that found large gaps between supplier certificates and measured purity [13], focuses on the method as much as the result.
How a lab validates these methods
A purity or identity result is only as reliable as the method behind it. The ICH Q2(R2) guideline, adopted by the FDA, sets out how analytical procedures are validated [15]. The characteristics most relevant to peptide testing are:
| Validation characteristic | What it shows |
|---|---|
| Specificity | The method can distinguish the target from impurities and other components. |
| Accuracy | Results agree with the true value. |
| Precision | Repeated measurements agree with each other. |
| Range and linearity | Results are reliable across the concentrations tested. |
| Detection and quantitation limits | The smallest amount of impurity that can be detected and measured. |
When a COA names a method, such as "RP-HPLC" or "LC-MS", it is pointing to a validated procedure. A bare number with no method behind it gives you nothing to evaluate.
How to read the HPLC and MS lines on a COA
When you have a peptide certificate of analysis in front of you, check the analytical lines in this order:
- Lot number. It must match the vial. Every result below it describes only that lot.
- Identity method and result. Look for LC-MS, ESI-MS or MALDI-TOF, ideally with the measured mass shown beside the theoretical mass.
- Purity method and result. Look for RP-HPLC with a specification (for example ≥ 98.0%) and the measured value.
- The chromatogram or peak table. It should show one dominant peak, a stable baseline and a total that matches the reported purity.
- Potency or net peptide content. This is the amount, not the ratio, and is often slightly below the label for the reasons above.
- The laboratory. It should be named and contactable, with a report ID that can be verified.
| What you see on the COA | Stronger | Weaker |
|---|---|---|
| Identity | "LC-MS: 1418.7 Da observed vs 1418.7 Da theoretical" | "Identity: OK" with no method |
| Purity | "RP-HPLC, 214 nm: 99.23% (spec ≥ 98.0%)" | "Purity: 99%+" with no method |
| Evidence | Chromatogram and mass spectrum attached | Number only |
| Source | Independent lab, report ID, lot match | Supplier template, no lot number |
What these tests do not tell you
HPLC and mass spectrometry describe the chemical composition of a material at the time it was tested. They do not describe how a compound behaves in any biological system, establish safety or effectiveness for any purpose, or account for what happens to a vial after it leaves the lab. Research compounds are not approved by the FDA for human or veterinary use.
How Codex Research reports these results
Where a lot's results have been reported, the Codex Research COA shows purity by RP-HPLC for that specific lot against a 98.0% specification, and full reports add identity by LC-MS, potency, endotoxin, sterility and microbial results, with the testing laboratory and report ID. You can match the lot number on any product page to the vial before purchase. For how to verify a full report with the lab that issued it, read our guide on third-party testing. For how the two methods apply to specific compounds, see BPC-157 vs TB-500, where about 530 Da separates the two masses, and Glow vs Klow, where one HPLC run has to resolve up to four peptides. If you need the certificate for a specific lot, contact info@codexresearch.shop.
Frequently asked questions
What is the difference between HPLC and mass spectrometry for peptides?
Which is better for testing peptide purity, HPLC or mass spec?
What does LC-MS mean on a COA?
Can a peptide pass HPLC and still be the wrong compound?
Why is HPLC purity measured at 214 or 220 nm?
What is the difference between monoisotopic and average mass?
Why does a mass spectrum show more than one peak for one peptide?
What impurities can mass spectrometry detect?
What can mass spectrometry not detect?
What can HPLC not detect?
What is a chromatogram?
Why does TFA matter in peptide testing?
What is tandem mass spectrometry (MS/MS)?
What is an orthogonal method?
How do I check the HPLC and MS results on a COA?
References
- Mant CT, Chen Y, Yan Z, et al. HPLC analysis and purification of peptides. Methods Mol Biol. 2007;386:3-55.
- Mant CT, Kovacs JM, Kim HM, et al. Intrinsic amino acid side-chain hydrophilicity/hydrophobicity coefficients determined by reversed-phase HPLC of model peptides. Biopolymers. 2009;92(6):573-595.
- Fenn JB, Mann M, Meng CK, Wong SF, Whitehouse CM. Electrospray ionization for mass spectrometry of large biomolecules. Science. 1989;246(4926):64-71.
- Karas M, Hillenkamp F. Laser desorption ionization of proteins with molecular masses exceeding 10,000 daltons. Anal Chem. 1988;60(20):2299-2301.
- Aebersold R, Mann M. Mass spectrometry-based proteomics. Nature. 2003;422(6928):198-207.
- Mao Y, Kleinberg A, Zhao Y, et al. Simple addition of glycine in trifluoroacetic acid-containing mobile phases enhances the sensitivity of electrospray ionization mass spectrometry for biopharmaceutical characterization. Anal Chem. 2020;92(13):8691-8696.
- Johnson D, Boyes B, Orlando R. The use of ammonium formate as a mobile-phase modifier for LC-MS/MS analysis of tryptic digests. J Biomol Tech. 2013;24(4):187-197.
- Lincoln D, Fell AF, Anderson NH, England D. Assessment of chromatographic peak purity of drugs by multivariate analysis of diode-array and mass spectrometric data. J Pharm Biomed Anal. 1992;10(10-12):837-844.
- Wu P, Zhang T, Wang G, et al. Direct characterization of leucine and isoleucine residues in peptides using high-resolution tandem mass spectrometry. Anal Chem. 2026;98(28):20912-20925.
- Wu P, Cheng Y, Li D, et al. Comparison of structurally related impurity profiles in teriparatide from synthetic and recombinant DNA origin using liquid chromatography-high resolution mass spectrometry. Rapid Commun Mass Spectrom. 2026;40(17):e70125.
- Vukoja A, Pavić E, Galović S, et al. Comprehensive analysis of peptide pharmaceutical: development of three orthogonal chromatographic methods and characterization of bivalirudin degradation products by high-resolution mass spectrometry. J Pharm Biomed Anal. 2027;283:117761.
- D’Hondt M, Bracke N, Taevernier L, et al. Related impurities in peptide medicines. J Pharm Biomed Anal. 2014;101:2-30.
- Verbeke F, Wynendaele E, Braet S, D’Hondt M, De Spiegeleer B. Quality evaluation of synthetic quorum sensing peptides used in R&D. J Pharm Anal. 2015;5(3):169-181.
- U.S. FDA. ANDAs for Certain Highly Purified Synthetic Peptide Drug Products That Refer to Listed Drugs of rDNA Origin. Guidance for Industry, May 2021.
- U.S. FDA / ICH. Q2(R2) Validation of Analytical Procedures. Guidance for Industry, March 2024.



 From lab to your door